
Map #13: November 7, 2016
Difficulty Level: 3
Click here for a full-size version of this week’s map.
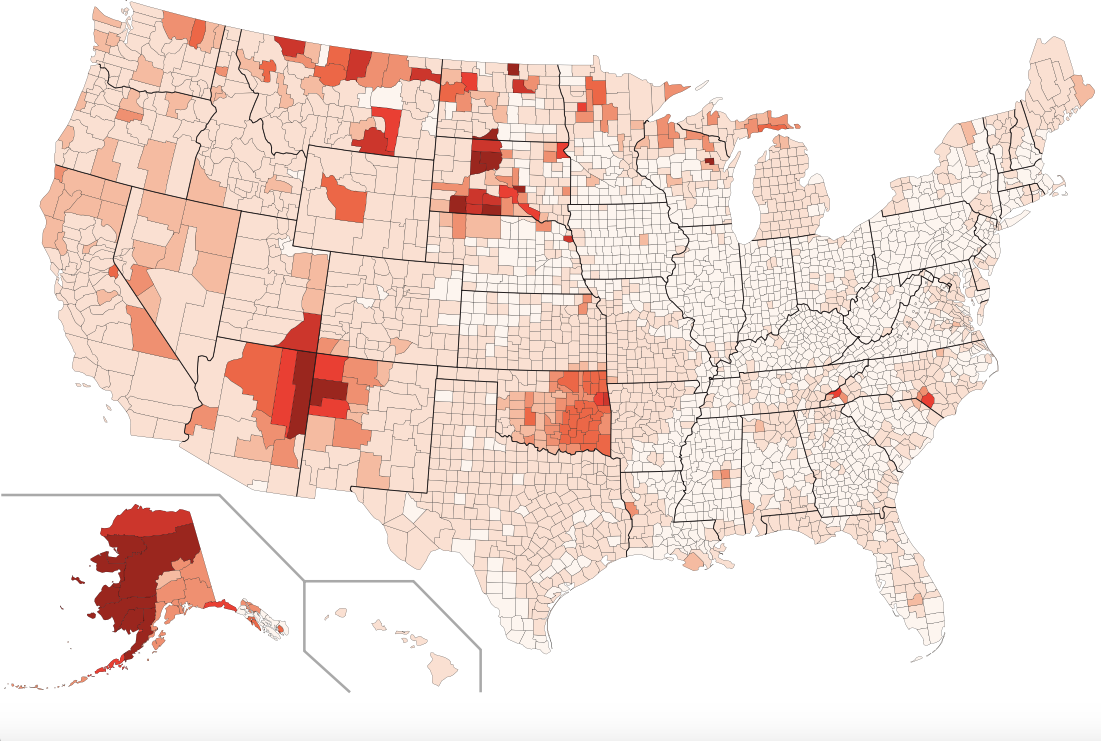
This map is a choropleth of the United States. (Do you need a refresher on what a choropleth is? Visit our “Basics” page for a quick primer.) On this map, each county is shaded in accordance with a particular statistic. The darker shades of red represent counties that possess more of a particular statistic. Please note that we have fiddled a bit with the scale here in order to accommodate a very wide range of values; our goal has been to highlight areas with extreme values, and we have done so by abandoning our usual policy of using equal intervals for the data classes. Your job for this week: figure out what statistic is represented by this choropleth.
Stumped? Check back Tuesday, Wednesday, Thursday, and Friday for hints about where to focus your investigation. The answer will be posted on Monday, November 14. Good luck!
Tuesday’s hint: While this map emphasizes counties with extreme values, it can still tell you something about those counties that do not appear red on this map. First, one thing to bear in mind is that the value of this week’s mystery statistic is zero for only two exceedingly sparsely populated counties—and positive for the other 3,142. You shouldn’t guess something that the majority of counties do not have. Second, you may have noticed that the eastern half of the United States has much less red than the western half. That general trend, visible on a current map, is the result of several centuries of explicit government policies. To solve this map, you may want to think about the longterm history of the United States.
Wednesday’s hint: One of the interesting things about this map is the fact that Alaska appears very red. Within Alaska, notice where the most red counties are: generally farther north, and especially in less populated areas. The “boroughs”—note that Alaska has boroughs rather than counties—that are home to Anchorage and Fairbanks are less red than the less populated areas to the north and west. One question you should consider is what kind of person lives in more rural parts of Alaska.
Thursday’s hint: Oklahoma is a state that sticks out clearly on this map, especially in the eastern part of the state. In 1907, Oklahoma was the 46th state to join the U.S.—fully 46 years after neighboring Kansas. You might also be intrigued to know that part of what is now Oklahoma made a failed bid for statehood two years earlier in 1905. It’s all an interesting story, and if you look it up, it might help you solve this map!
Friday’s hint: This is a great map for which to look up individual counties that appear in dark red. Some suggestions: Menominee County, Wisconsin; Oglala Lakota County, South Dakota; and Apache County, Arizona. What do these three counties have in common?
Answer: Click here to see an explanation of the answer to this week’s map question.
Next map: Click here to try out our newest map question.
