
Map #14a: November 14, 2016
Geography Awareness Week 2016
Difficulty Level: 5
Click here for a full-size version of this week’s map.
In celebration of Geography Awareness Week, we have three maps this week. Please submit solutions for the three maps separately, taking care to use the same name and email address. Each of the three maps will have its own hints as usual, and a perfect score for the week will be worth a total of 15 points. Make sure to check out Map #14b and Map #14c as well as this map.
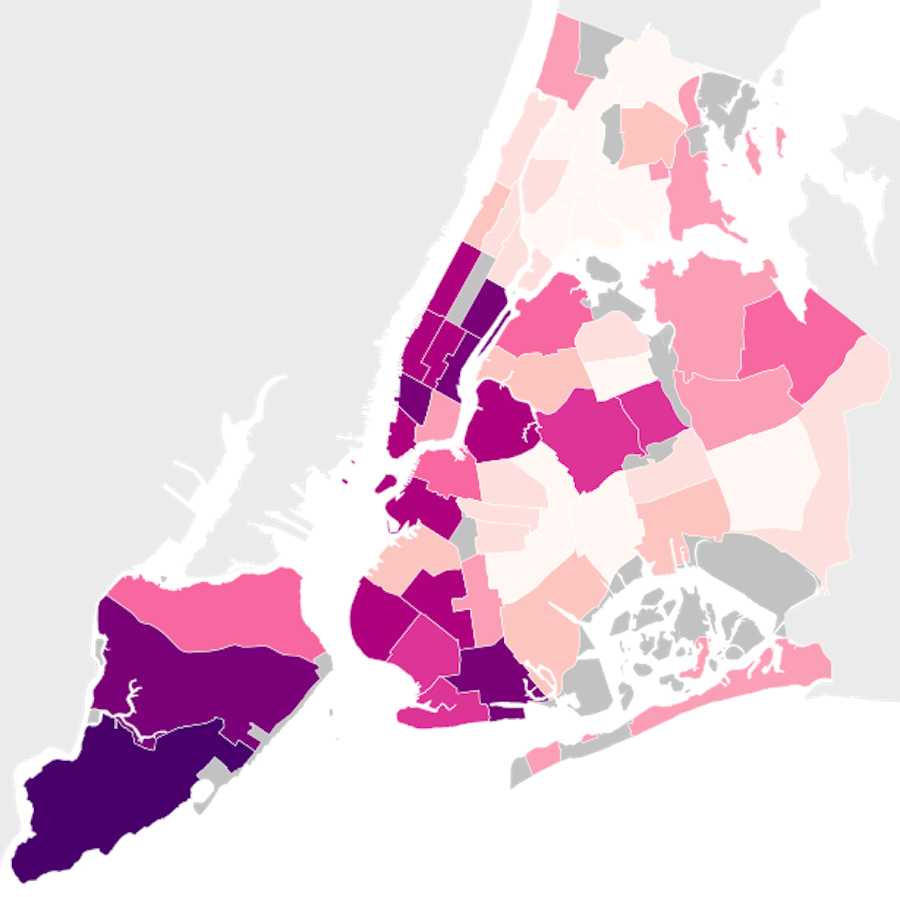
This map is a choropleth of a major world city. (Do you need a refresher on what a choropleth is? Visit our “Basics” page for a quick primer.) On this map, each section of the city is shaded in accordance with a particular statistic. The darker shades of purple represent areas that possess more of a particular statistic. Your job for this week: figure out what city this is and what statistic is represented by this choropleth.
Stumped? Check back Tuesday, Wednesday, Thursday, and Friday for hints about where to focus your investigation. The answer will be posted on Monday, November 21. Good luck!
Tuesday’s hint: This city, as most of you will have recognized fairly quickly, is New York City. The island in the southwest is Staten Island. Brooklyn and Queens are in the south on the western end of Long Island; north of them are Manhattan and the Bronx. This is a good map on which to investigate individual “community districts” (that’s what these divisions are called). One interesting place to begin are Brooklyn community districts #13 and #15, home to such neighborhoods as Brighton Beach and Sheepshead Bay.
Wednesday’s hint: Another intriguing place on this map is the one section of the southern part of Manhattan that is not as dark as the surrounding community districts. It’s the one in the southeastern part of the island. Look up this area and see what it’s famous for. What might you see if you walked down the street in this section of Manhattan? Whom would you meet there?
Thursday’s hint: The darkest purple on this map can be found in the southern part of Staten Island in the far southwest corner of this map. This same part of Staten Island has also stood out clearly on another recent choropleth that has shown up in the news: this was one of the very few areas of New York City to vote in large numbers for Donald Trump in the 2016 presidential election (see choropleth here). This fact is related to the solution to this map, though the correct answer itself has nothing to do with politics. There is something demographically unique about Staten Island—a characteristic that is not shared by the four other boroughs. If you can figure out what that is, you should be well on your way to solving this map.
Friday’s hint: The grey rectangle in the middle of Manhattan is Central Park. On either side, colored in fairly dark purple, are the relatively wealthy areas of the Upper West Side and the Upper East Side. To the north of Central Park, beyond 110th street, is the beginning of an area which is much, much less purple. This is the neighborhood of Harlem. Beyond that, as you go toward the narrow northern tip of the island of Manhattan, is Washington Heights. Both Harlem and Washington Heights are closely associated with particular racial and ethnic communities. How do the demographic makeups of these neighborhoods in the northern part of Manhattan differ from that of the neighborhoods farther south on the island?
Answer: Click here to see an explanation of the answer to this week’s map question.
Next map: Click here to try out our newest map question.
