
Map #14b: November 14, 2016
Geography Awareness Week 2016
Difficulty Level: 6
Click here for a full-size version of this week’s map.
In celebration of Geography Awareness Week, we have three maps this week. Please submit solutions for the three maps separately, taking care to use the same name and email address. Each of the three maps will have its own hints as usual, and a perfect score for the week will be worth a total of 15 points. Make sure to check out Map #14a and Map #14c as well as this map.
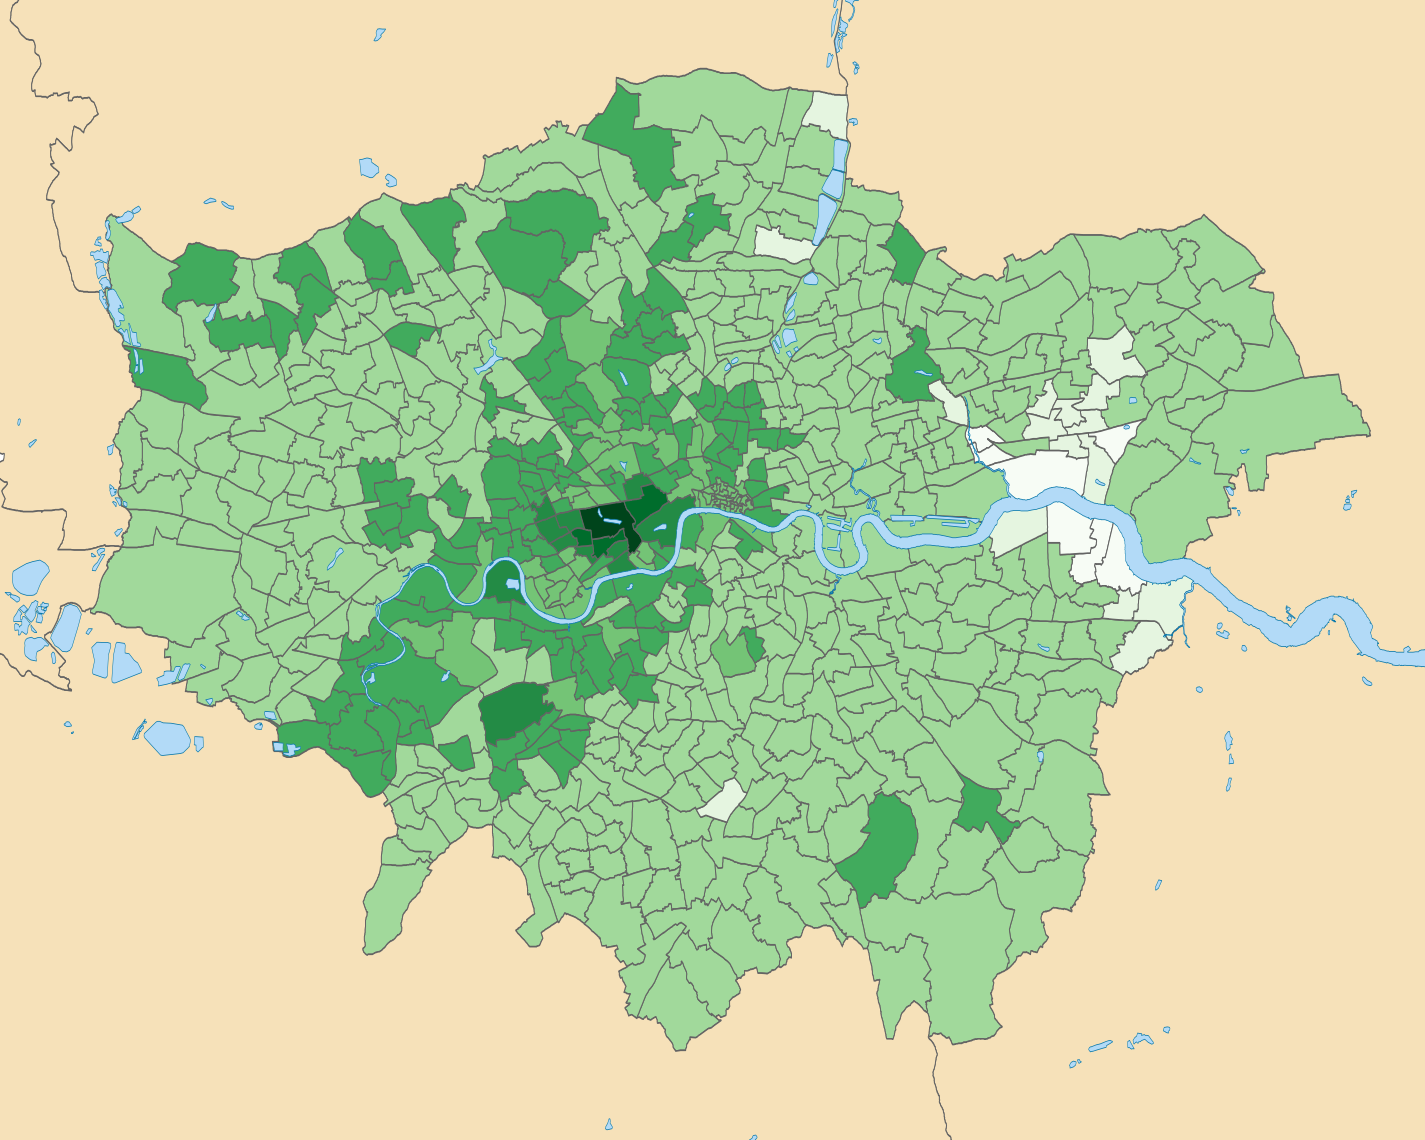
This map is a choropleth of the metropolitan area of a major world city. (Do you need a refresher on what a choropleth is? Visit our “Basics” page for a quick primer.) On this map, each section of the city is shaded in accordance with a particular statistic. The darker shades of green represent areas that possess more of a particular statistic. Note that the maps would look similar for several different statistics which are closely correlated, so we’ll be lenient in accepting anything close for this one. Your job for this week: figure out what city this is and what statistic is represented by this choropleth.
Stumped? Check back Tuesday, Wednesday, Thursday, and Friday for hints about where to focus your investigation. The answer will be posted on Monday, November 21. Good luck!
Tuesday’s hint: There’s an interesting pattern in the northwest part of this map, where you can see an alternating pattern of darker and lighter green. Several of these darker areas contain stations on subway and train lines. This pattern doesn’t line up exactly with this city’s subway system, but it’s fairly close. Your solution will have to explain why the green is darker in areas that are more conveniently served by public transportation.
Wednesday’s hint: The city depicted in this map is London, which you may have been able to recognize by the shape of the River Thames running through the middle of it. Each of the divisions on this map is a “ward,” which is a distinction used for elections to the councils of London’s various boroughs. The tight mass of very small wards in the center of the map is the area known as the “City of London,” location of much of London’s finance industry; we have colored all the small wards of the City the same, rather than trying to differentiate among them. One of the trends that emerges clearly from this map is that the areas along the Thames in west London are quite green. You might want to look up the borough of Richmond upon Thames, which is the medium-dark green area along the Thames in western London. Among the sights of Richmond are Hampton Court Palace, Kew Gardens, and many areas of expansive parks. Does learning about Richmond help you make sense of this map?
Thursday’s hint: The eastern part of this map is home to the wards that appear least green. Many of these wards are in the borough of Bexley or the borough of Barking and Dagenham. Barking and Dagenham keeps showing up the news, but generally for unpleasant reasons. Just this week, a study named it “London’s least vibrant borough.” In August, it was named the “most miserable place in the United Kingdom.” If you spend a little time reading about Barking and Dagenham, you may be able to solve this map fairly easily.
Friday’s hint: Just west of the center of this map, a single ward stands out as especially dark green. Actually, we have fudged the scale a little bit here: this one neighborhood is elevated so dramatically in this map’s mystery statistic that it should be three full shades of green darker than it is. The majority of this ward is covered by Hyde Park; that lake you can see in the middle of it is the famous Serpentine. To the south of Hyde Park is the neighborhood of Belgravia, which comprises the rest of this ward. See what you can learn online about Belgravia. One article that might help you is this Vanity Fair piece from April 2013 about a particular residential building in the vicinity. (Technically, this building is actually on the other side of Sloane Street, a few feet beyond the boundaries of the darkest ward on this map. But the ward it’s in, Brompton, is also very dark.)
Answer: Click here to see an explanation of the answer to this week’s map question.
Next map: Click here to try out our newest map question.
