

Map #39: May 15, 2017
Difficulty Level: 9
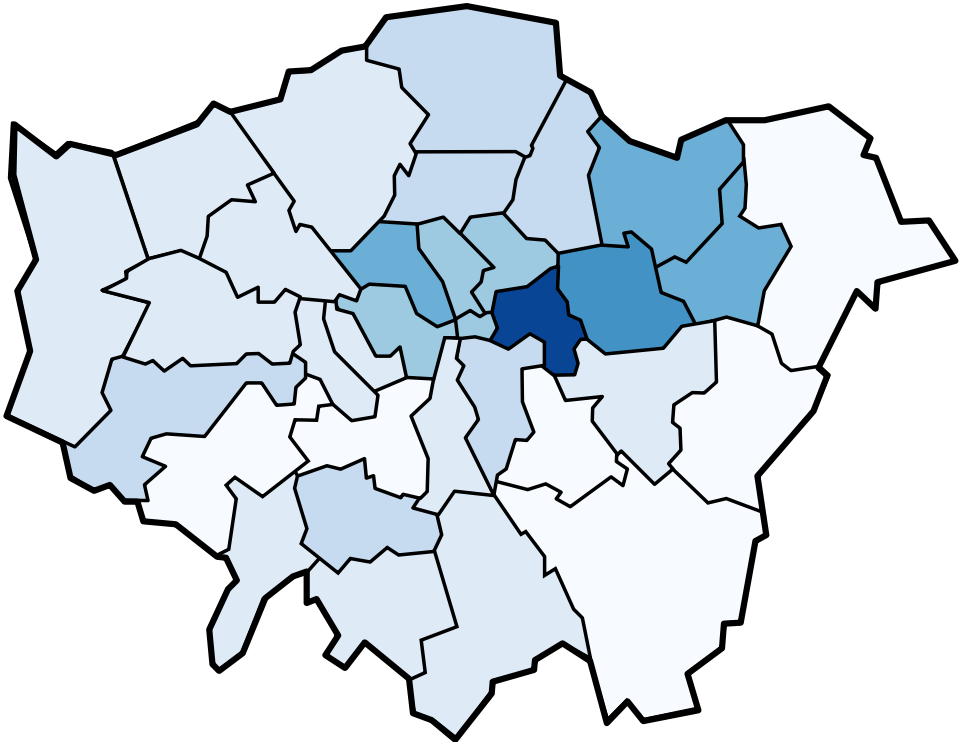
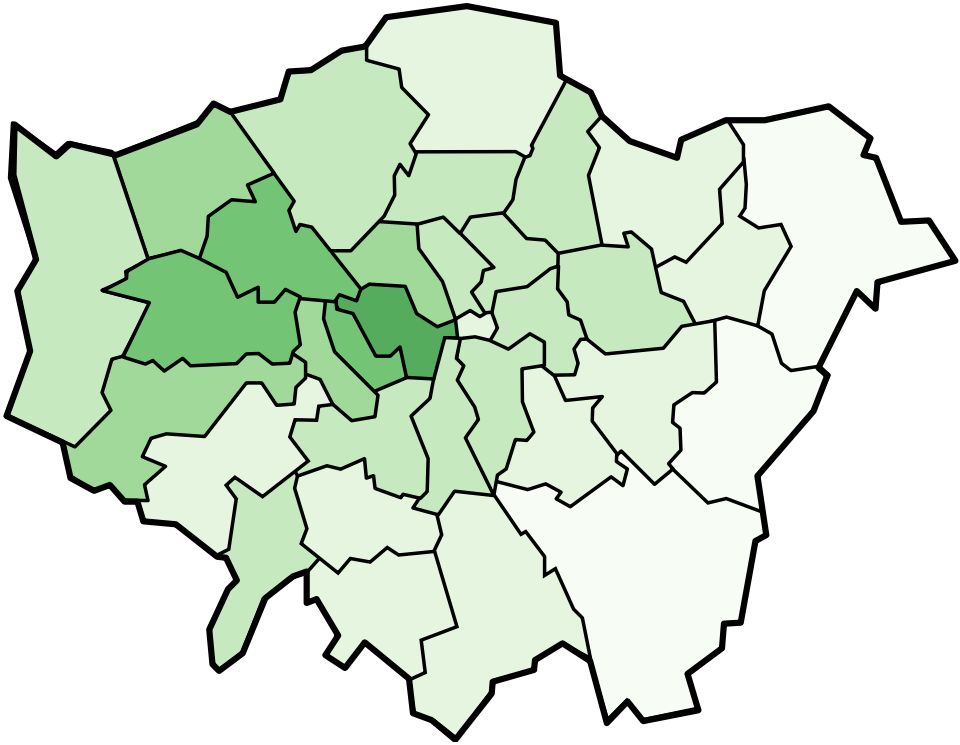
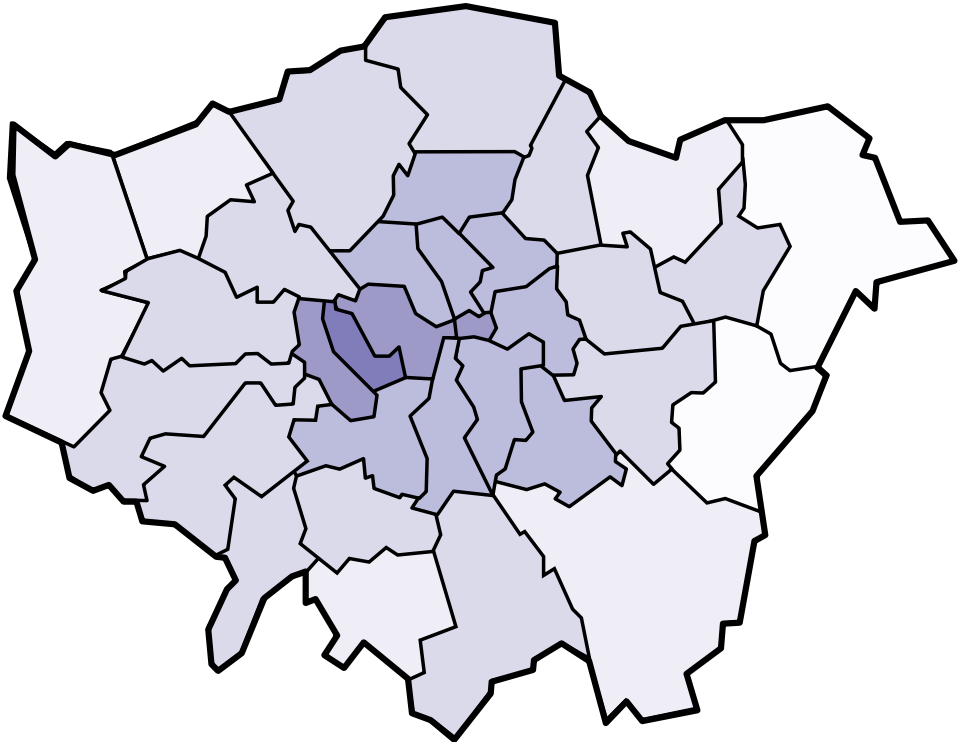
This week, we have four related maps. Here are links to larger versions of Map #39a (blue), Map #39b (green), Map #39c (orange), and Map #39d (purple).
This week is the fourth week in a five-week series. During this series, we will keep track of both the usual week-to-week scores and your cumulative score over the five-week period.
These maps are choropleths of a major world city. (Do you need a refresher on what a choropleth is? Visit our “Basics” page for a quick primer.) The four maps have different solutions, but they are closely related. In order to get full credit this week, you’ll have to identify all four maps (don’t worry—there will be a scheme for partial credit). Since the maps are connected, you can explain all four maps in a single submission. Once again, the scales are exaggerated (as was the case with Map #24 and Map #35), and the scales are consistent across the four maps, albeit with different colors. In other words, the lightest shade of blue indicates exactly the same range of values as the lightest shade of green or the lightest shade of purple. Your job is to figure out what statistics are represented on these four choropleths.
Stumped? Check back Tuesday, Wednesday, Thursday, and Friday for hints about where to focus your investigation. The answer will be posted on Monday, May 22. Good luck!
Tuesday’s hint: This city should be fairly easy to recognize as London because we had a map of London just a few weeks ago. In this case, we have shaded the various boroughs of the city. To solve this map, you will almost certainly need to investigate individual boroughs. So let’s start with the purple map. Here, the purple is generally concentrated in the center of the city, with the darkest area in the borough of Kensington and Chelsea. Kensington and Chelsea is quite a wealthy borough. Whereas this week’s three other maps have a lot of color in poorer, outlying boroughs, the purple map is concentrated largely in wealthier areas.
Wednesday’s hint: Sometimes, our mid-week hints tell you to investigate recent news stories. But this week, you might have more luck if you just focus on fiction. In particular, a perusal of Monica Ali’s novel Brick Lane might help you solve the blue choropleth.
Thursday’s hint: The darkest borough on the green choropleth is Westminster, right in the heart of London. You can find many interesting places in Westminster, but, for the purposes of this map, the one which would be most relevant to you would be Edgware Road.
Friday’s hint: These choropleths represent the percentage of speakers of certain foreign languages in each borough (and, in some cases, maps of language are indistinguishable from maps about ethnicity or national origin). But which languages? That’s what you need to figure out!
Answer: Click here to see an explanation of the answer to this week’s map question.
Next map: Click here to try out our newest map question.
