
Map #40: May 22, 2017
Difficulty Level: 8
Click here for a full-size version of this week’s map.
This week is the final week in a five-week series. During this series, we will keep track of both the usual week-to-week scores and your cumulative score over the five-week period.
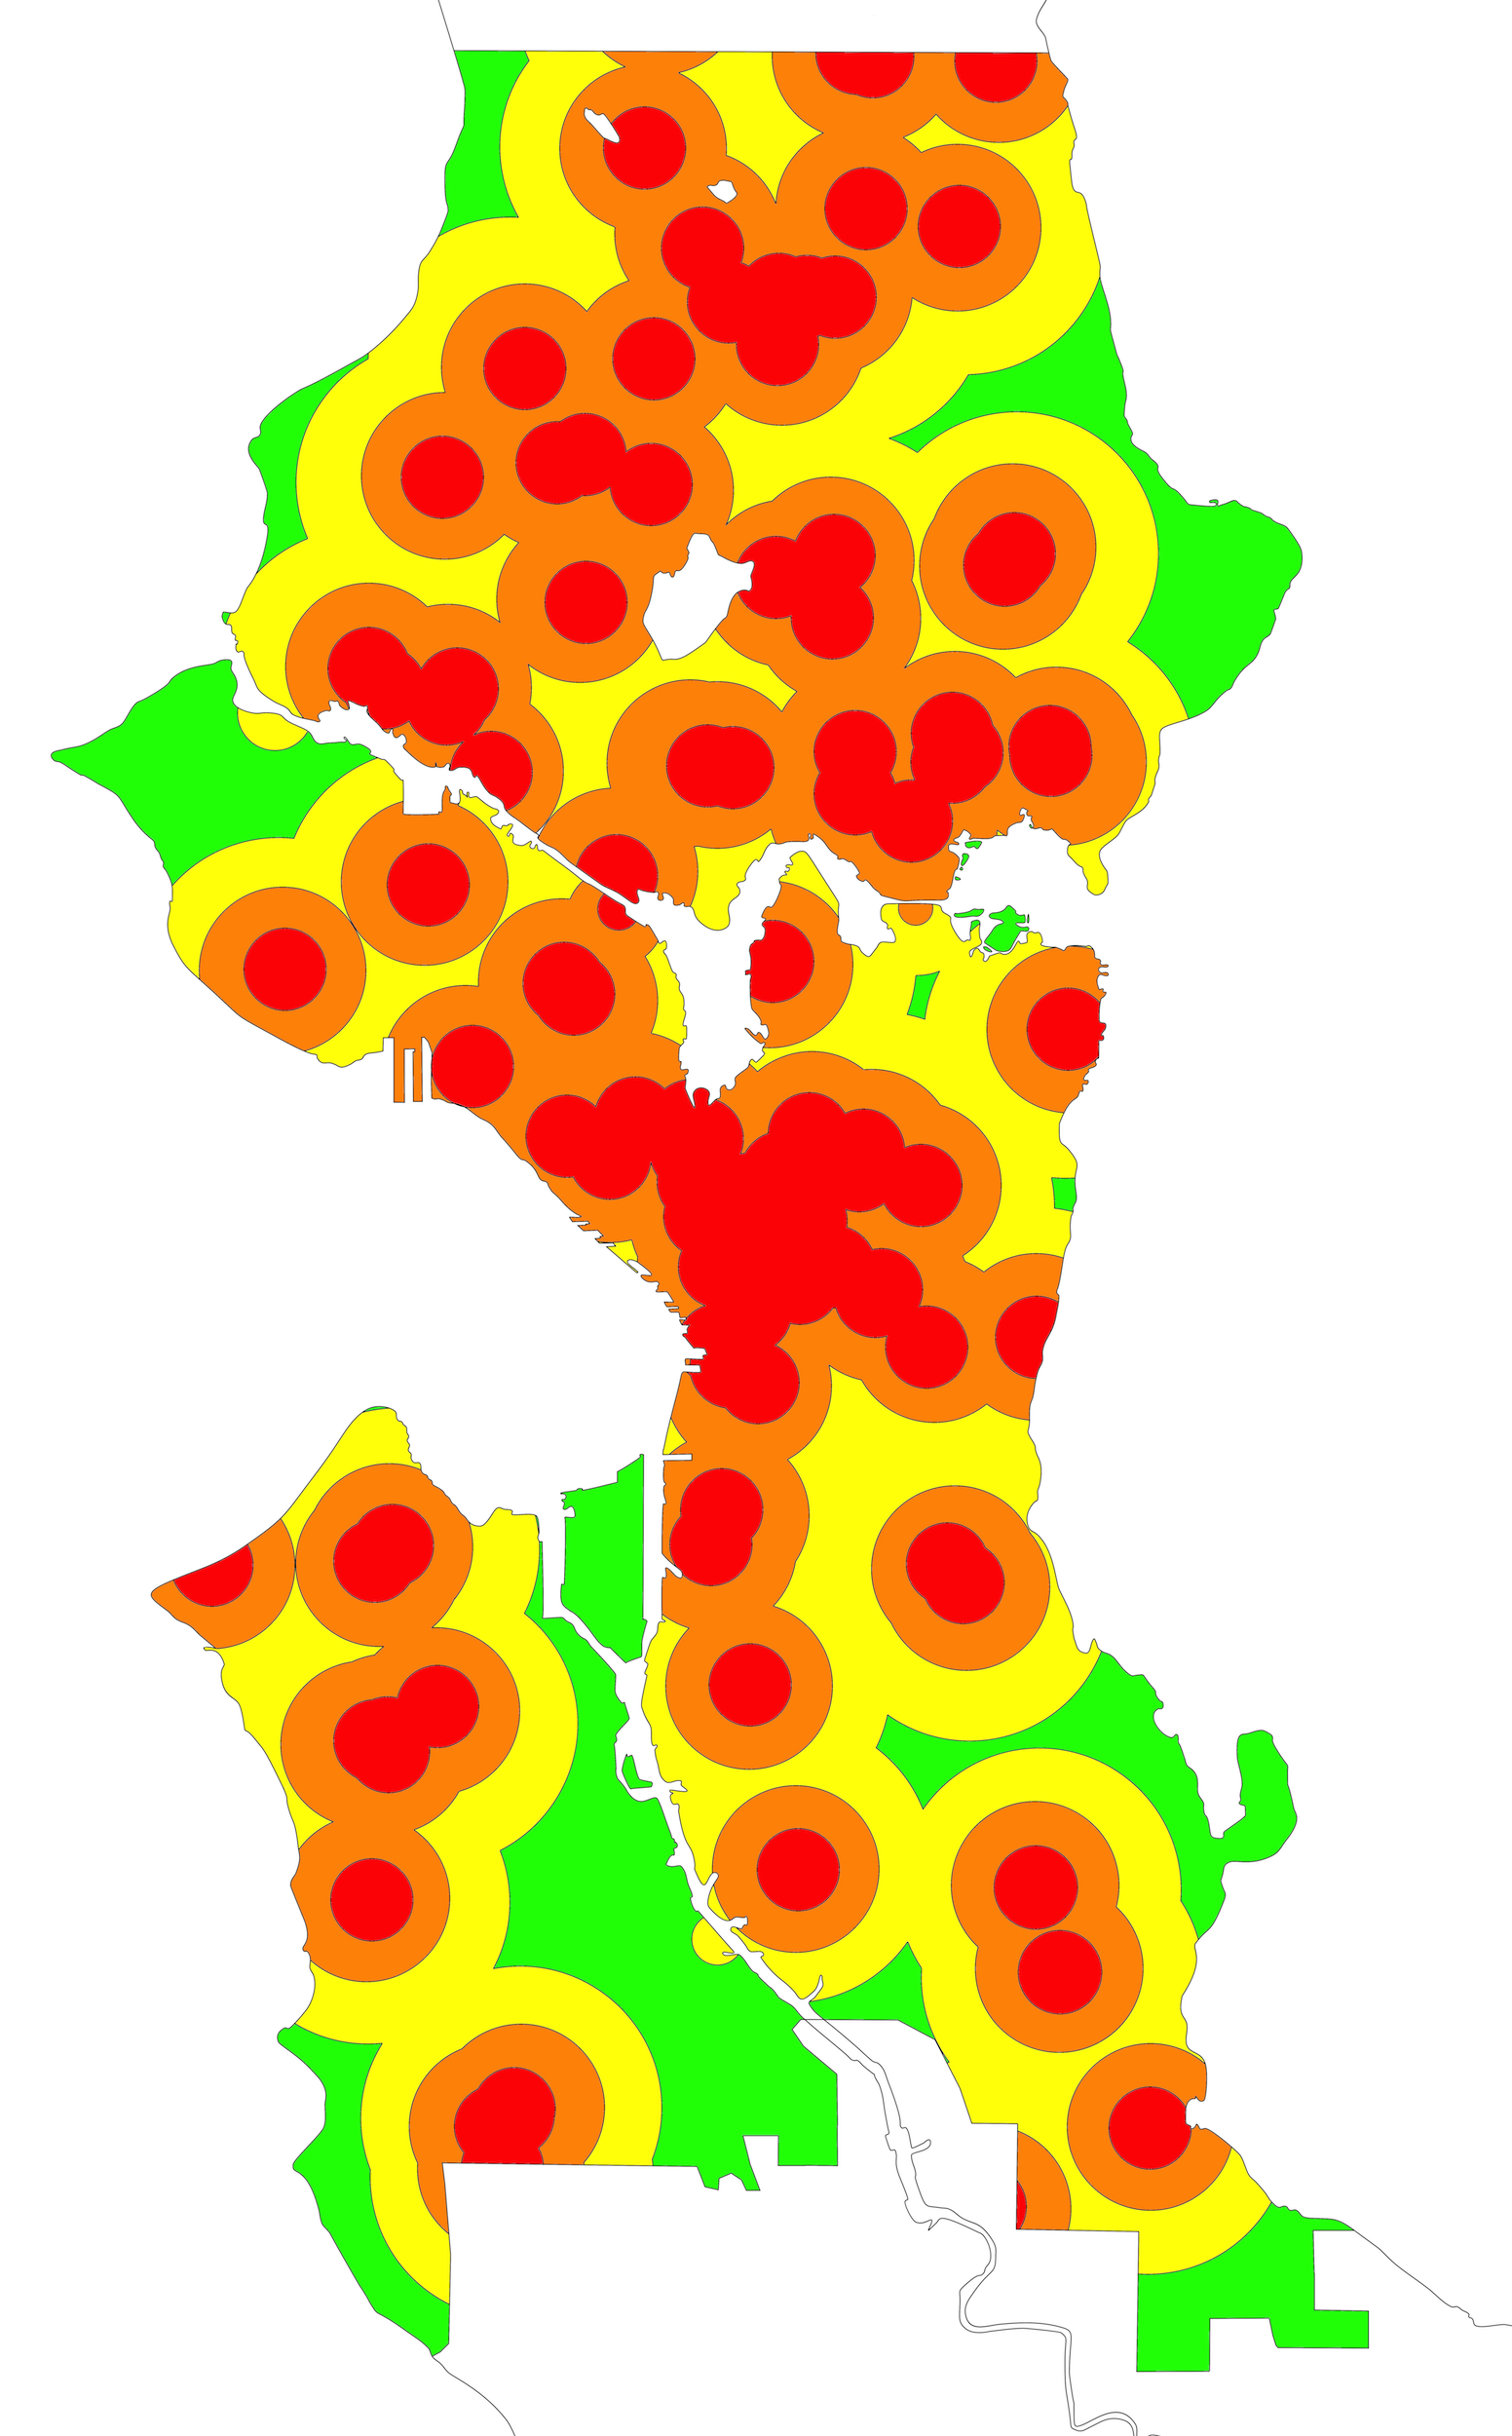
This map is an isoline map of a major world city. (Do you need a refresher on what an isoline map is? Visit our “Basics” page for a quick primer.) There isn’t that much to say about this one other than good luck! Your job is to figure out what statistic is represented by this isoline map.
Stumped? Check back Tuesday, Wednesday, Thursday, and Friday for hints about where to focus your investigation. The answer will be posted on Monday, May 29. Good luck!
Update: We made a few changes to this week’s map to add a few more red areas that we missed in the original version. We also retroactively set the difficulty at level 8. Sometimes, maps don’t turn out to be as complicated in practice as it seems like they should be when we dream them up.
Tuesday’s hint: Let’s begin by taking stock of this map. We have a city that is relatively skinny, squeezed between a lake to the east and an inlet of the ocean to the west. The city’s downtown corresponds almost exactly to the area where the red is most concentrated on this map. Two of the other places where red is most concentrated are in the neighborhoods around shopping malls farther to the north.
Wednesday’s hint: The city on this map is Seattle. What’s interesting about this map is how many places on the map are red, indicating areas within the highest level of isoline. This pattern runs in contrast to our previous isoline maps, which had clear centers where the highest levels could be found. That means that you have to find something that can be spread throughout the city, albeit with greater density in the downtown corridor.
Thursday’s hint: For the most part, this map is made up of interlocking perfect circles of identical sizes. The only places where you see deviations from this pattern is around bridges, such as the Fremont Bridge and the Montlake Bridge. The consistency of the circles stands in contrast to most isoline maps, which are fairly rough. That should tell you that we’re looking for something that is possible to represent with perfect circles...like, for example, walking distances.
Friday’s hint: So what would you find at the center of each of the red circles on this map? Well, it has to be something that people in Seattle are not willing to travel very far to get, and thus something that is spread around absolutely everywhere. The blob of red that covers the entire downtown area on this map obscures one of Seattle’s great absurdities: if you start at the corner of 2nd and Seneca and walk two blocks north to 2nd and Union, you’ll see four of something.
Answer: Click here to see an explanation of the answer to this week’s map question.
Next map: Click here to try out our newest map question.
