
Map #53: August 21, 2017
Difficulty Level: 7
Click here for a full-size version of this week’s map.
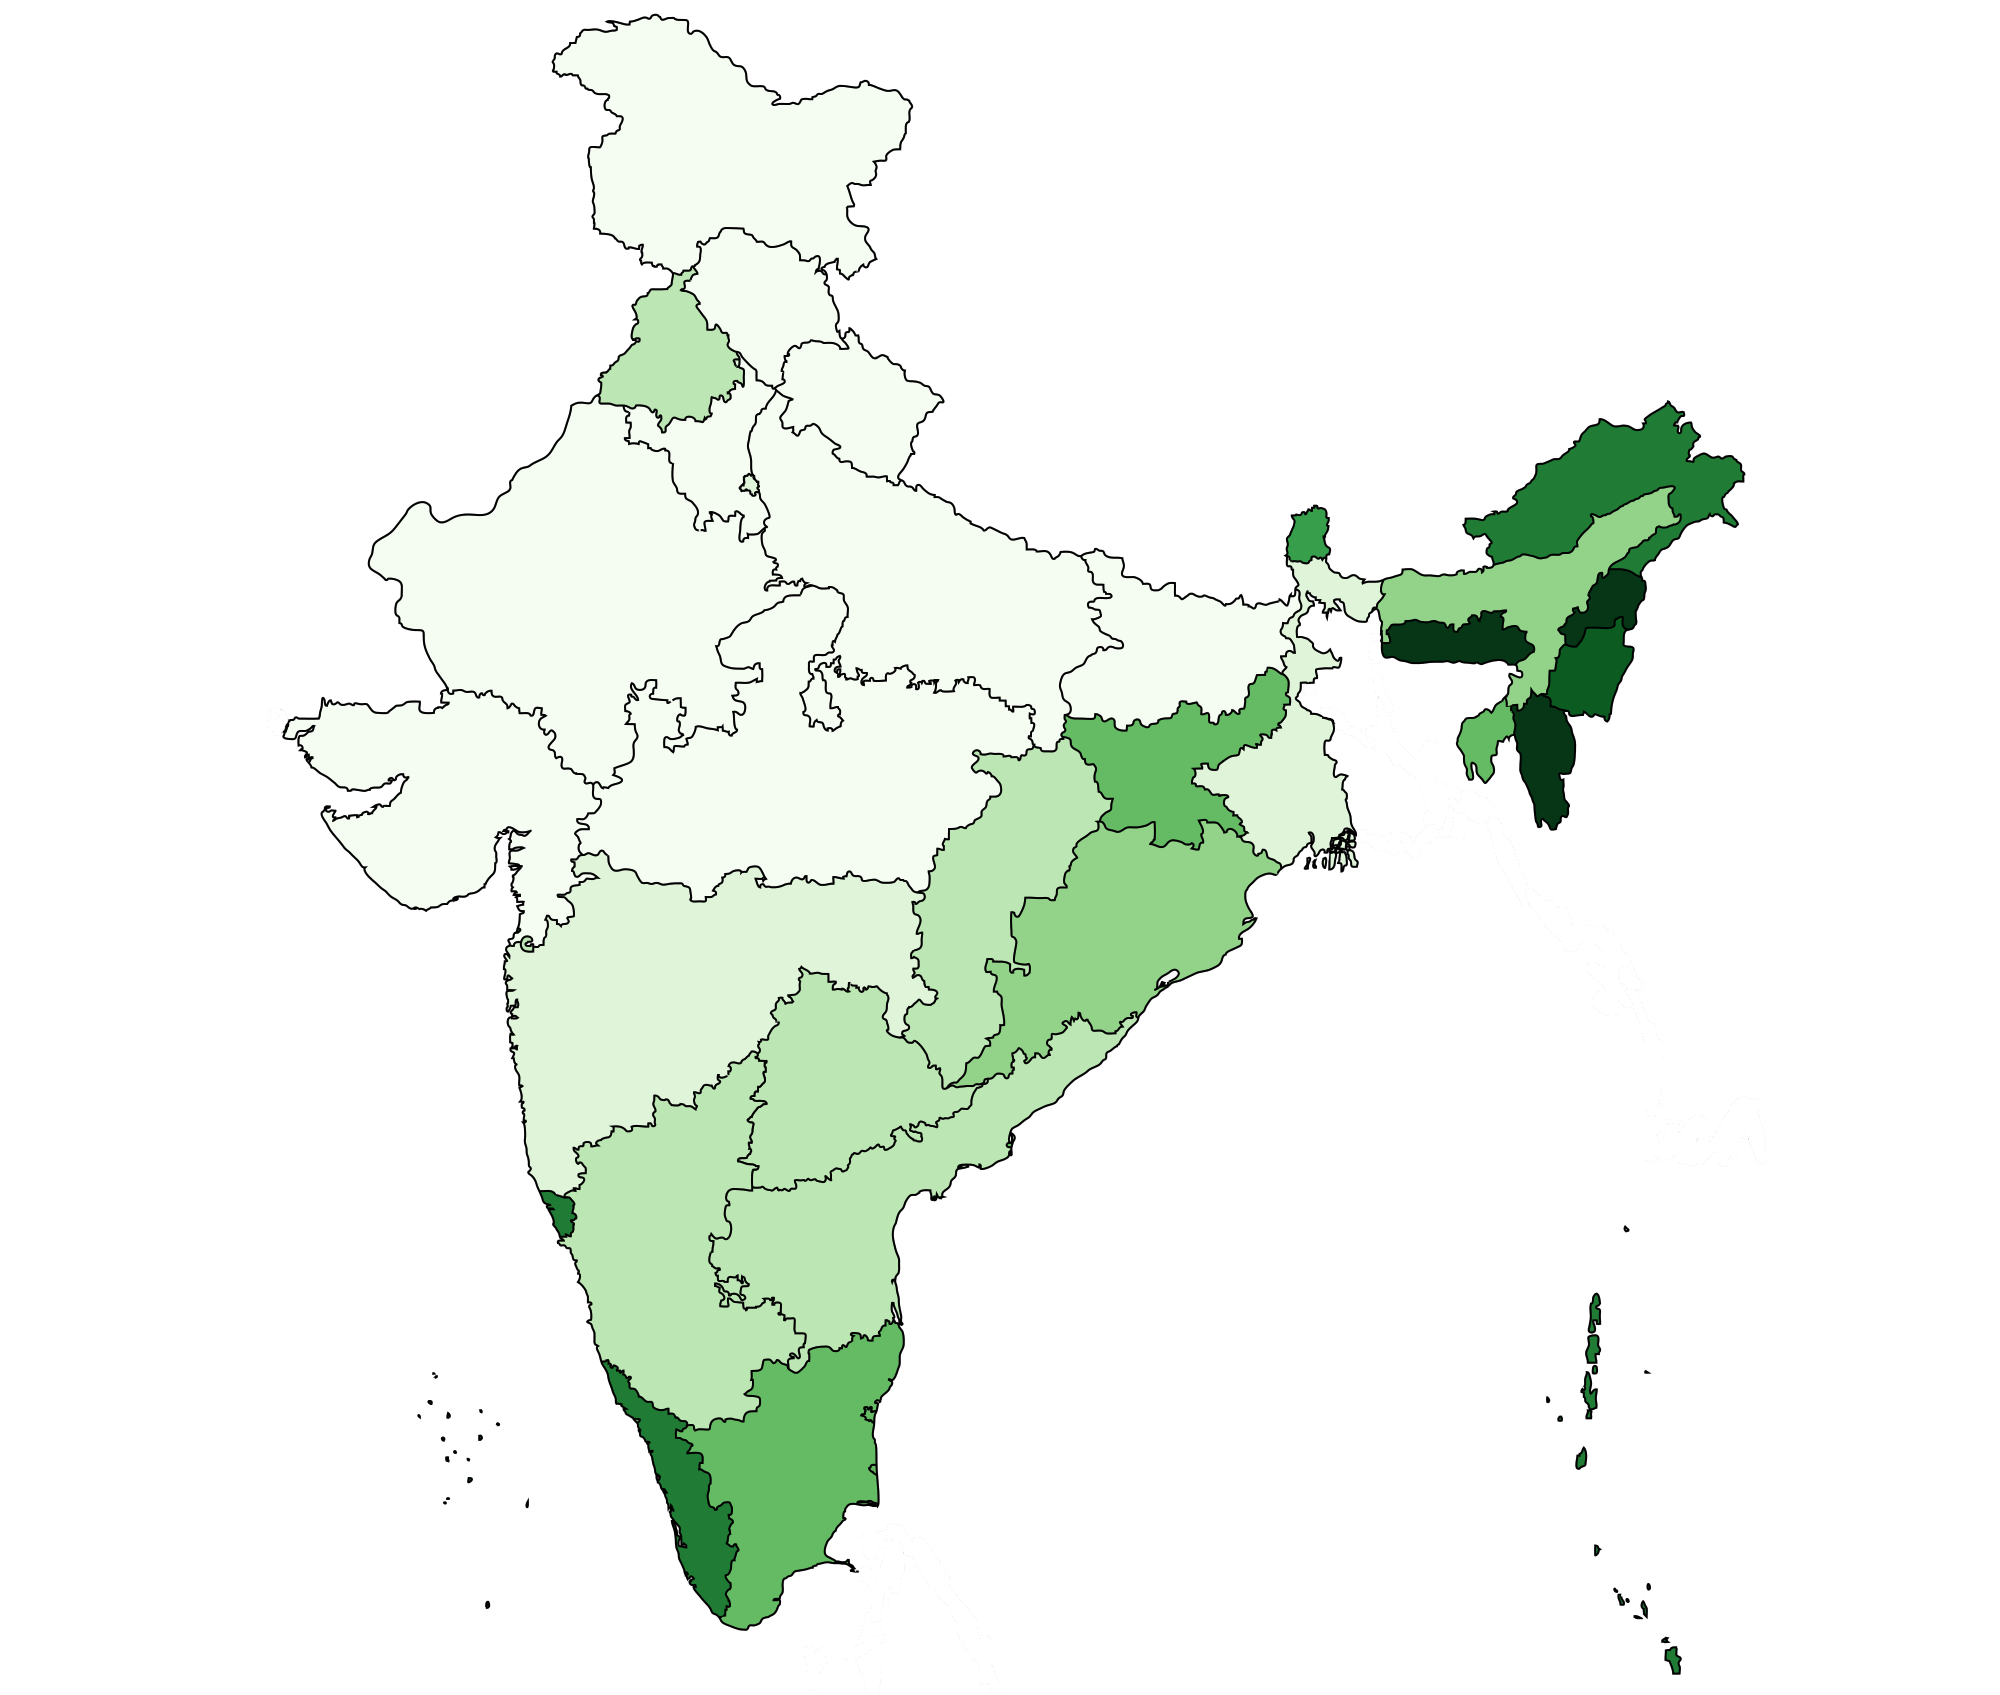
This map is a choropleth of the states of India. (Do you need a refresher on what a choropleth is? Visit our “Basics” page for a quick primer.) On this map, each state is colored in proportion to a particular statistic. This map has an exaggerated scale, which means that the states that are the darkest green have much, much more of the statistic in question than do the states that are the lightest green. A quick note: we have colored Telangana the same shade as Andhra Pradesh, the state from which it split off in 2014, because our data is from 2011. As always, your job is to figure out what this choropleth represents.
Stumped? Check back Tuesday, Wednesday, Thursday, and Friday for hints about where to focus your investigation. The answer will be posted on Monday, August 28. Good luck!
Tuesday’s hint: This is our second choropleth of the states of India. Before tackling this map, you may want to look back at Map #26, which showed the percentage of vegetarians in each Indian state. On that map, the trend was that the states in the north and west were generally the darkest. This map is somewhat the opposite: it is darkest in the east and the south. You may want to start perusing this map by brainstorming some trends that might be the opposite of Map #26.
Wednesday’s hint: One especially dark area on this map is the state of Goa. Whereas most of India gained independence from the United Kingdom in 1947, the situation in Goa was different. Goa was a Portuguese colony, and Portugal refused to give up its territory (which also included Daman and Diu, two other places that are fairly dark on this map). In 1961, the Indian army invaded Goa and conquered it within two days. Today, Goa is part of India, but it retains some legacies of its Portuguese heritage—enough, at least, to make it fairly dark on this map.
Thursday’s hint: The three darkest states on this map are in the eastern part of India: Nagaland, Mizoram, and Meghalaya. The level of the mystery statistic in these states is around 74% in Meghalaya and even higher (over 87%) in Nagaland and Mizoram.
Friday’s hint: On Tuesday, we encouraged you to look back at Map #26, a map of vegetarians. In the hints for Map #26, we talked a bit about how that map aligned, at least to some degree, with India’s current brand of Hindu nationalist politics under the leadership of Narendra Modi. This week’s very different map is also linked to religion, but not to Hinduism. Can you figure out which religious community is best represented in the darkest green areas?
Answer: Click here to see an explanation of the answer to this week’s map question.
Next map: Click here to try out our newest map question.
