
Map #105: November 13, 2018
Difficulty Level: 6
Click here for a full-size version of this week’s map.
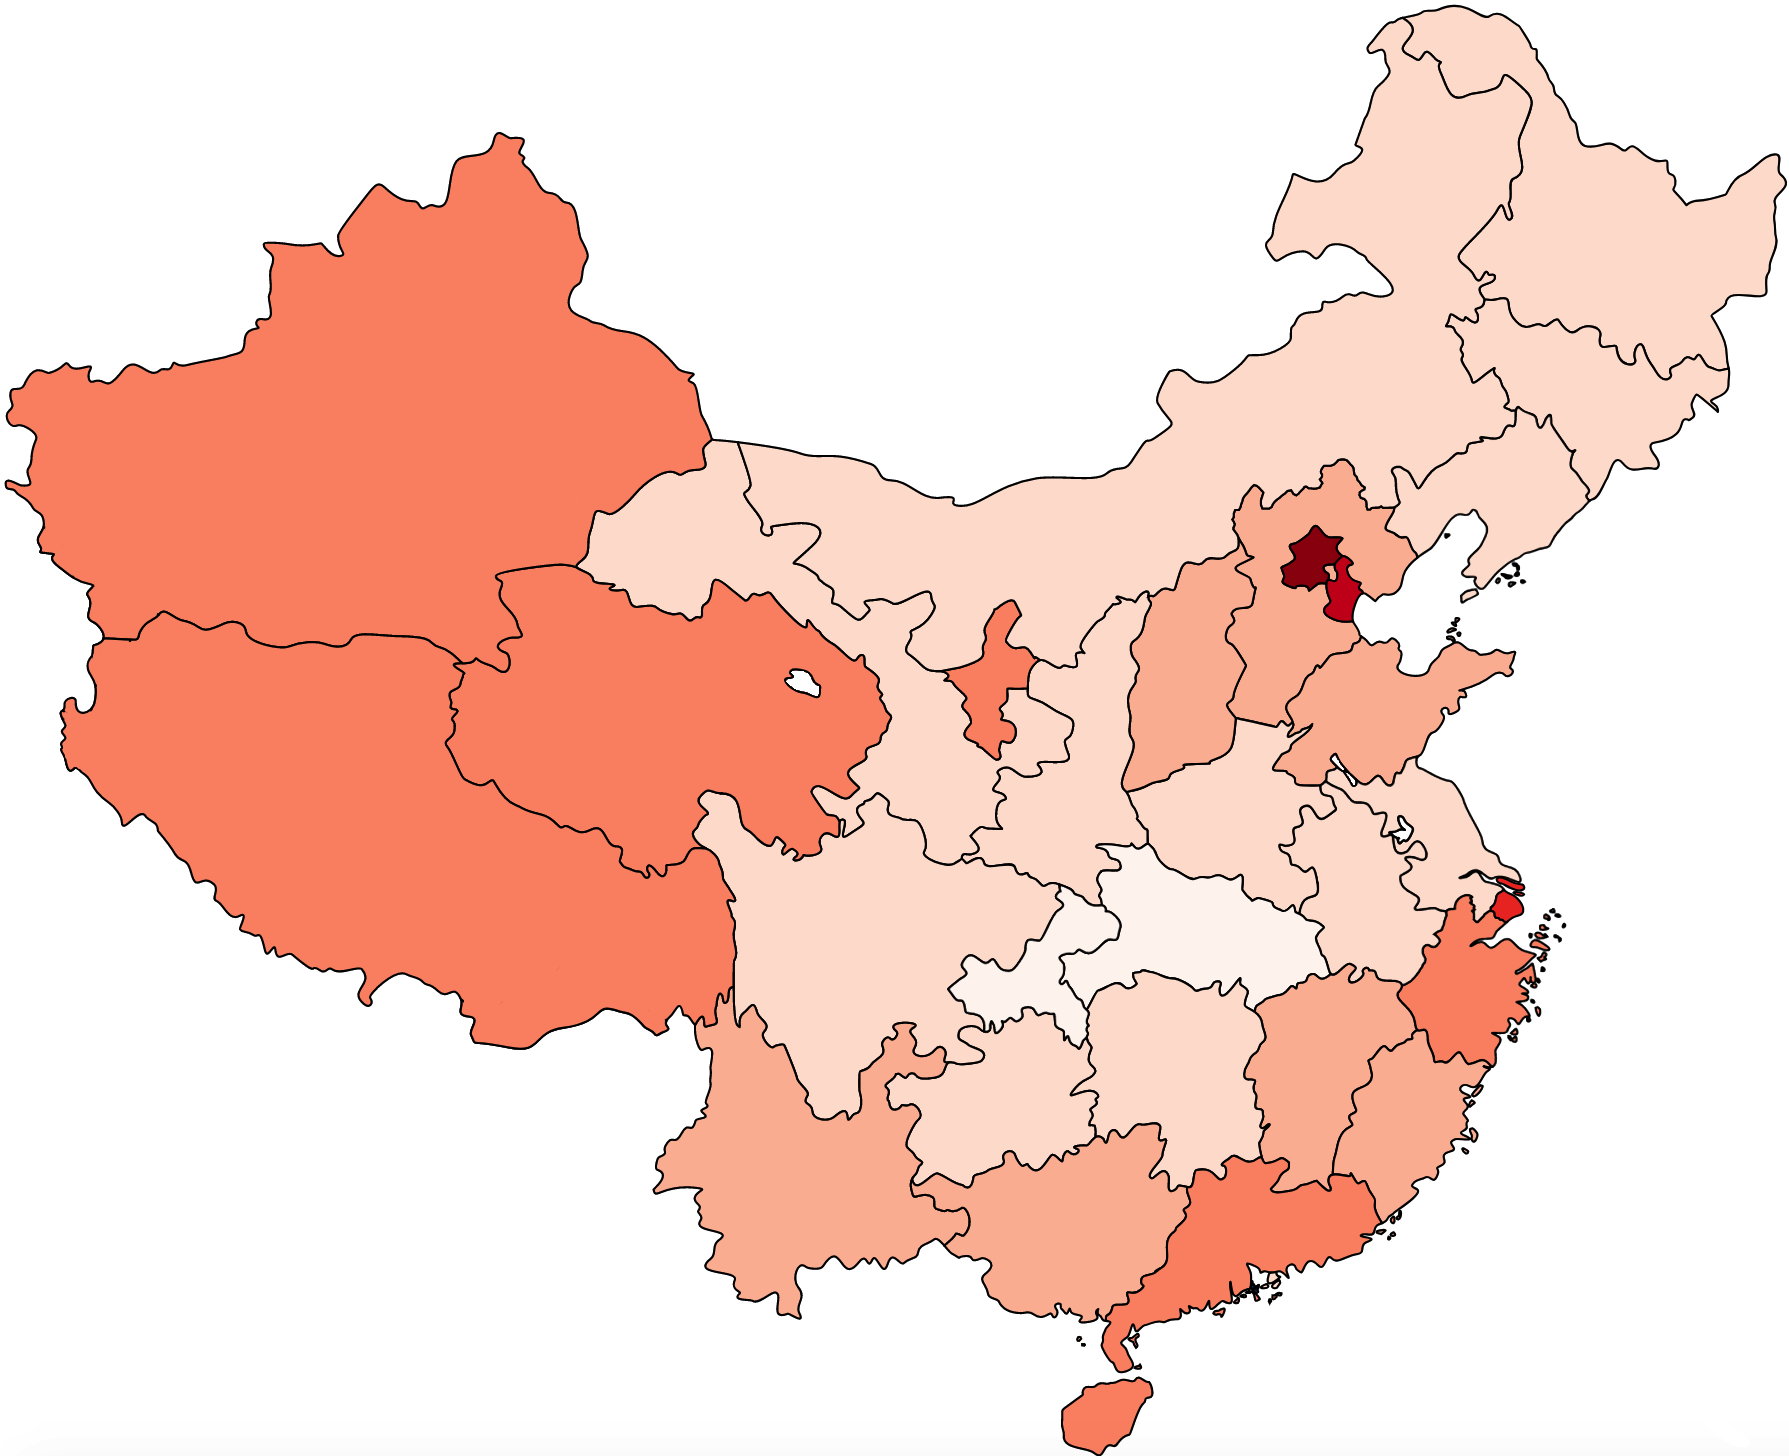
This map is a choropleth of the provinces of China. (Do you need a refresher on what a choropleth is? Visit our “Basics” page for a quick primer.) This map has gone up on a Tuesday instead of a Monday on account of the Veteran’s Day holiday. It has a linear scale, which means that a few of the colors are used on the great majority of the provinces without getting into fine-grained distinctions among them. We have left Taiwan off of the map entirely, but if we had wanted to include it, it would probably be the second lightest shade. As always, your job is to figure out what this choropleth represents.
Stumped? Check back Wednesday, Thursday, Friday, and Saturday for hints about where to focus your investigation. The answer will be posted on Monday, November 19, 2018. Good luck!
Tuesday evening’s update: There was a problem for much of the day with the submission form, so we’ll try to post hints this week in the evening rather than the morning. It should work now.
Wednesday’s hint: The darker areas on this map include both China’s biggest urban areas (Beijing, Tianjin, Shanghai, Guangzhou) and the autonomous regions on the far margins of the country (Xinjiang, Tibet). That’s something of an unusual pattern: it means you need to look for something that applies to both big cities and the most sparsely populated parts of the country.
Thursday’s hint: We have had some incorrect guesses so far from people who saw the relatively dark colors of Xinjiang and Tibet and assumed that the map had something to do with ethnicity—it does not. But it is relevant to note that both Xinjiang and Tibet have seen the percentages of non-Han residents (that is, Uighurs and Tibetans) decline dramatically in recent years. Why?
Friday’s hint: Expanding on yesterday’s hint: it’s worth noting that Kashgar in extreme western Xinjiang was linked to the Chinese national rail system in 1999 and Lhasa in Tibet wasn’t connected until 2006, when engineers finally overcame the challenges posed by building at extreme altitude. Those cities are now much more directly integrated with the rest of China.
Saturday’s hint: 2011 was a pivotal year in China: it marked the year in which China switched from having a majority of its population living in rural areas to having a majority of its population living in urban areas. That trend of urbanization continues to this day. By 2017, the share of the population living in urban areas was over 59%.
Answer: Click here to see an explanation of the answer to this week’s map question.
Next map: Click here to try out our newest map question.
